Ana Yankova
Contribution
Data Preparation (~ 4 h)
- Looked at the available data formats and investigated different options for parsing the data
Project Proposal (~ 6 h)
- Discussed and defined the presentation content with the team
- Created the presentation slides
- Presented the proposal together with Christoffer and Andreas
Project Design and Research (~ 12 h)
- Took an active part in discussing and defining the project design
- Researched different visualization methods for the project
- Tested the project prototypes and gave feedback
Project Development and Testing (~ 8 h)
- Tested the project at every stage
- Identified and fixed issues
Final Presentation (~ 10 h)
- Discussed and defined the presentation content with the team
- Created the presentation slides
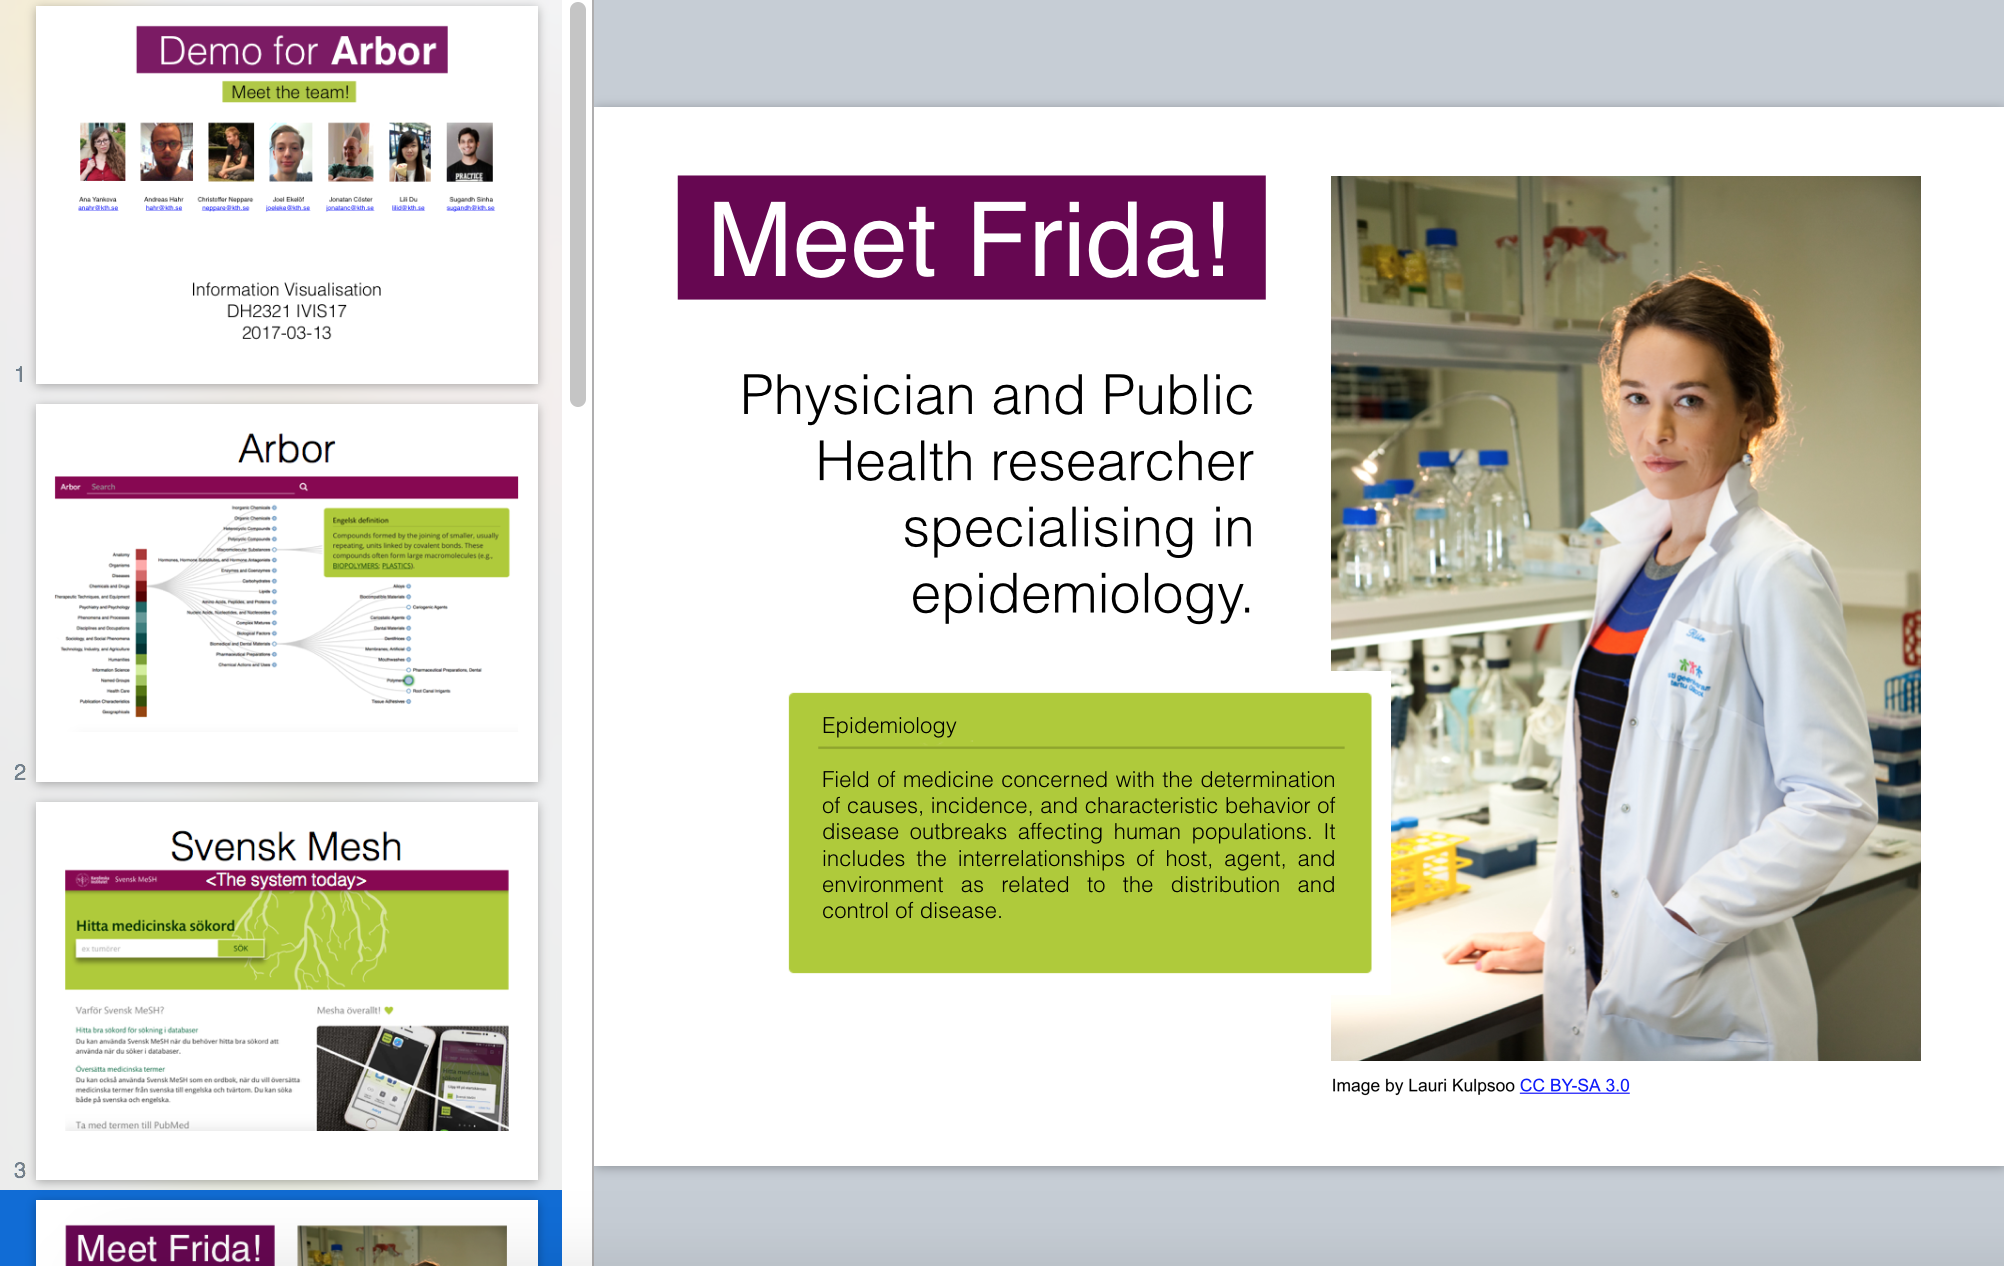
- Presented a case study of the usage of the system - a story of the typical user and her needs
Usability Testing (~ 10 h)
- Prepared a usability questionnaire together with Christoffer and a KI representative
- Carried out tests with students from KI to evaluate the user interface usability
- Analysed the test results
- Discussed the results with the team and identified further steps for improving the product
Image by Borys Kozielski CC-BY-4.0
Other Contributions (~ 16 h)
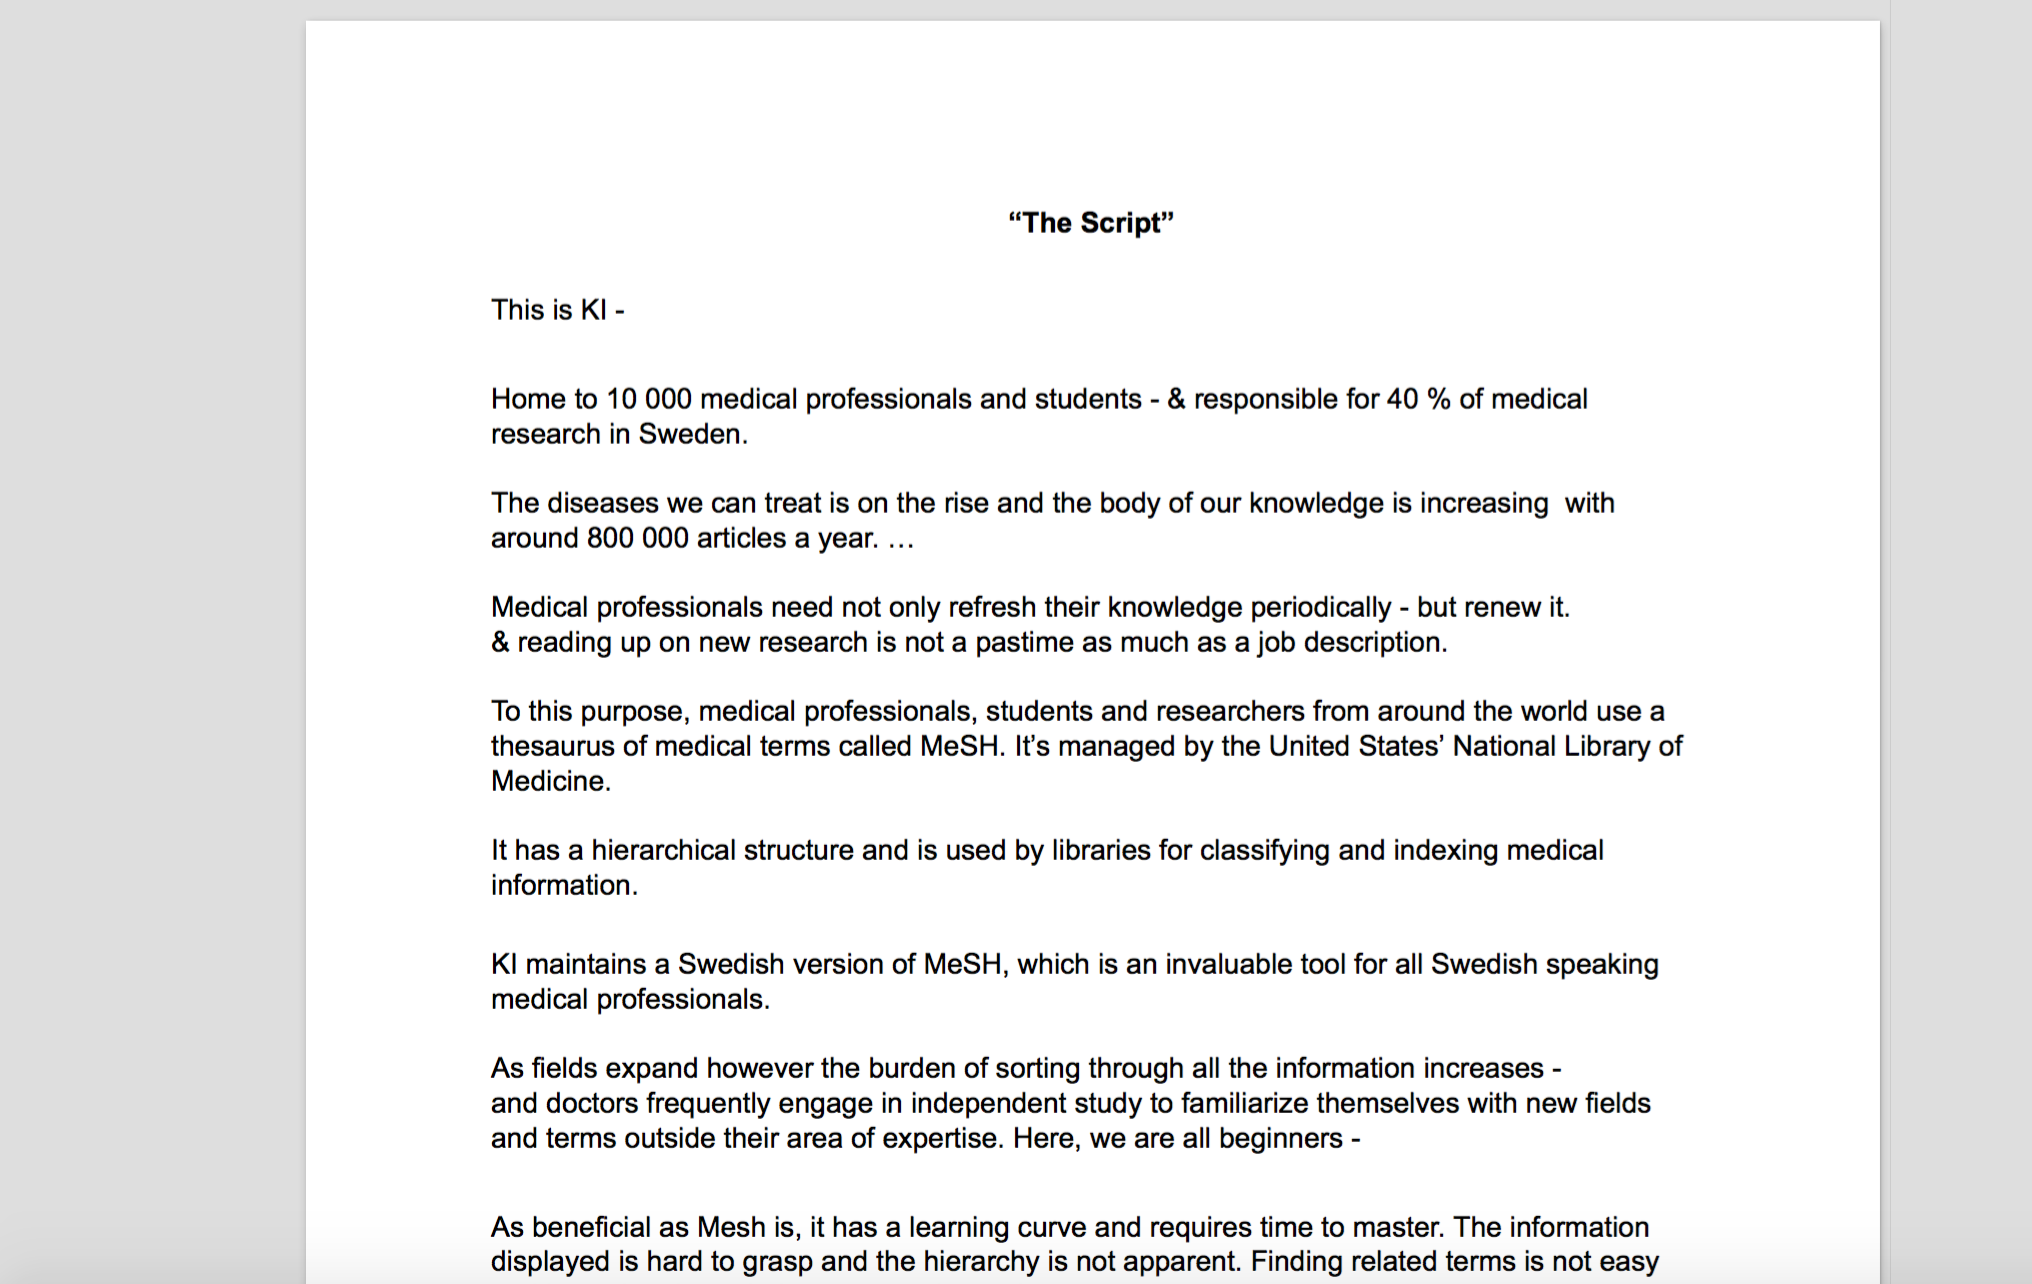
- Co-created the script for the C Awards video
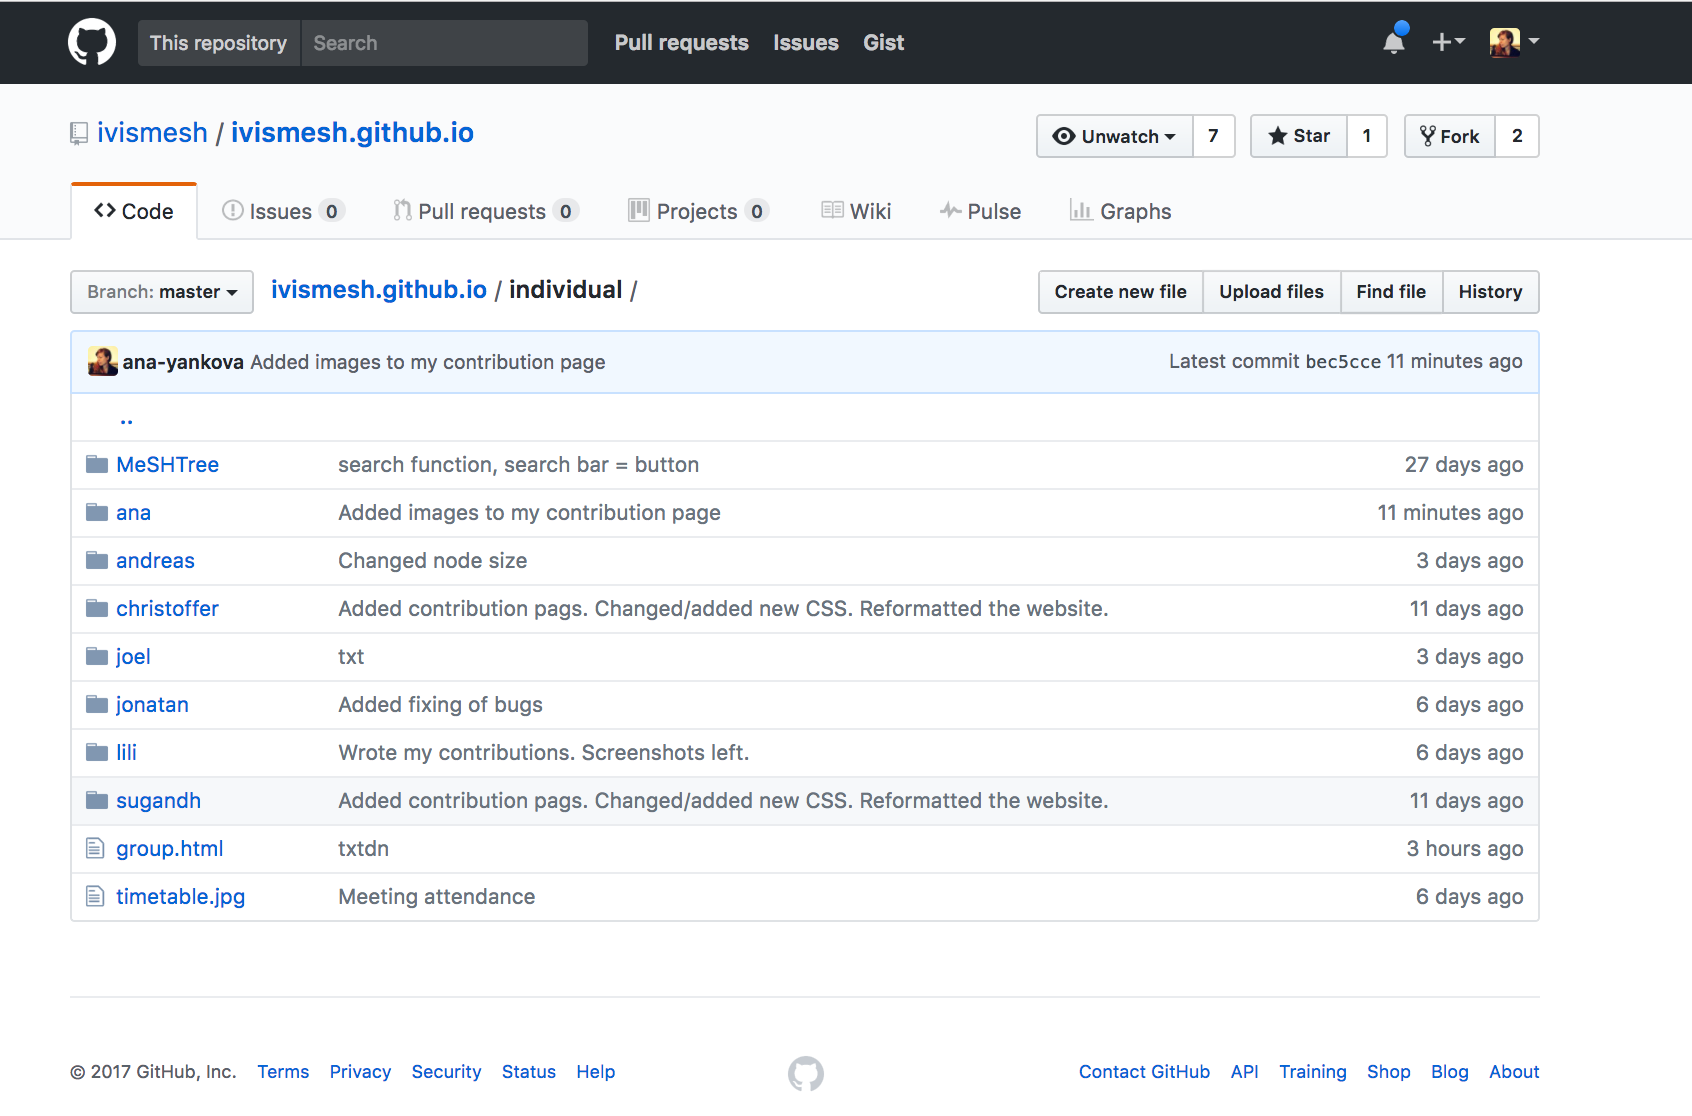
- Helped coordinate project assignments and initiate team communication
- Fixed issues with the website and the video
What I have learned
How to:
- Create information visualization systems with D3
- Demonstrate and explain an information visualization project
- Test and evaluate an information visualization system